by Julie | Jan 18, 2013 | Employee Training
How much time is spent thinking about slurry viscosity control? My guess is, not much. It seems to be a necessary evil of running a shell room, but not an area where we spend a lot of time.
What is the impact of the slurry viscosity being out of range? Operating outside of the targeted range could result in variations in shell thickness. If the back-up viscosity is running thick, then the mold weight could increase by up to 10%, especially in the later dips. If the viscosity is below the lower limit that could result in a thinner slurry layer and potential shell failures including run-outs or surface finish defects.
What is viscosity and why do we measure it? Viscosity is the measurement of a fluid’s resistance to flow, in our case, the slurry. A number of factors can impact the slurries viscosity, including liquid content (silica, water and polymer), particle size of the flour and temperature, to name a few.
Assuming a slurry is within specification for its key parameters, i.e. percent silica, temperature and refractory solids, the viscosity measurement is a value used in this industry which identifies how much slurry will be deposited on the wax pattern and/or previous dips. The ideal viscosity for slurry is dependent on the type of slurry and the part configuration. This is normally set by shell room management or by the supplier. The operator’s responsibility is to maintain the slurry within the designated range.
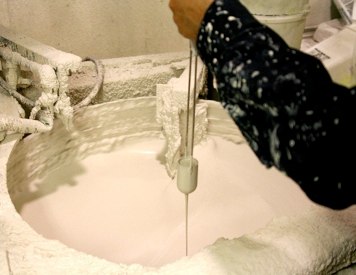
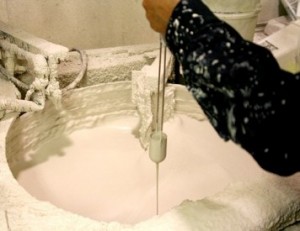
Viscosity is typically measured using a viscosity cup or in some instances a viscometer. Most commercial foundries using a viscosity cup establish a 2-second range and try to maintain the viscosity within that range.
However, the different techniques used by operators while measuring viscosity can have an impact on the value they record.
- To Rinse or not to Rinse: If the cup is stored in water, is it rinsed with slurry prior to taking a reading?
- Why Stop at One Reading: How many readings should be taken prior to recording?
- Location, Location, Location: Where in the tank is the slurry most uniform?
- Blink or ¼” stream: Are the operators looking for a blink or a stream break? If a stream break, what distance from the cup?
How you measure viscosity isn’t as important as ensuring that all your operators are doing it the same way. The amount of time it takes for a slurry to flow through a cup is relative, not absolute. But, you want your operators to minimize the variation.
Some operators are very comfortable taking viscosity readings. Inevitably, there will be an operator who is not comfortable measuring viscosity and his readings will be significantly different from the other operators. If the slurry is being adjusted based on this operator’s reading, the slurry could be adjusted to be out of the range.
Once you understand how viscosity control is being managed, you can start to address the variations. Training them not only on the viscosity procedure but also on why viscosity is important can go on long way towards improving viscosity control.
The final step is to continue to follow up on a regular basis to ensure that the operators are following the established procedure and reinforce the importance of viscosity control.

by Julie | Jan 16, 2013 | Consulting, Efficiency
I don’t know about you, but, I tend to steer way from New Year’s Resolutions. I haven’t been all that great about keeping them and so, instead of motivating me, they tend to discourage me. But, from a business perspective, the new year brings opportunities to find ways to be more efficient. This can be a more efficient use of my time, employee’s time or the overall process. One way to achieve that objective is to trust your employees to take ownership in fixing issues that are impacting their efficiency.
I remember when I was working in a bottling plant, we had a spot on the conveyor that collected the fallen bottles. But, the collection system wasn’t working and as result, kept backing up and knocking more bottles over. I spent some time (OK, a lot of time) and came up with this over-engineered solution to the problem. I showed my mechanic the problem and gave him my drawing on how he needed to fix the problem. Fortunately, I was working with an empowered mechanic who quietly studied the problem and presented a solution that was far superior to mine.
That experience taught me that we don’t always have to tell someone how to fix a problem, we just need to talk about the problem and allow input on how best to fix it. Chances are, their solution is much better than we could have imagined.
Having confidence in your employees is critical. And, if that isn’t something you are ready to do, than perhaps that would be a good New Year’s Resolution.

by Julie | Nov 8, 2012 | Employee Training
The mold cleaning and etch process seems to be one of those forgotten parts of the investment casting process. It isn’t like the parts look any cleaner when they come out of the tank. So, how important is this process to the overall process?
The purpose of the pattern cleaner is two fold – to clean the wax and to etch the surface to make it easier for the prime to hold onto the wax. While some foundries don’t try to etch the wax, almost all foundries recognize the need to clean the wax. A robust process prevents issues with slurry adhesion and coverage.
Like almost everything else in the precision investment casting process, not monitoring the process closely can lead to variability. So, here are few of the most common issues I have experienced when it comes to the etch process:
- Inconsistent immersion times. Not enough can cause issues with the adhesion of the wax to the prime. Too much can cause a rough wax surface.
- Wax build-up in the etch. This can reduce the efficacy of the pattern cleaner.
- Dirty rinse water. Not changing the rinse water impacts the effectiveness of the rinse. It is also a potential source of bacteria.
So, some good practices when it comes to the etch process, include:
- Post the etch time on or near the tank. In addition, put a clock in the area so the operator can verify the immersion time.
- Skim the etch tank prior to starting dipping. This is especially true if air is being bubbled into the tank.
- Check both the etch and rinse tanks for bacteria. This can be carried into the prime slurry causing stability issues.
- Identify a test that provides information on the efficacy of the cleaner. There have been a number of tests identified by the different suppliers. Find one that you are comfortable with and also provides meaningful data.
If you have some questions regarding your pattern cleaning process, don’t hesitate to give me a call or email me at julie@keyprocessinnovations.com. I can answer your questions and get you on your way towards a more robust process.

by Julie | Jun 6, 2012 | Consulting, Efficiency
I love this time of the year when the warm weather finally appears! The plants are growing and life is good! However, it is also the time of the year when shell drying related issues start to creep up!
So, I thought I’d share a few items to check if you start to see an increase in shell cracking as the weather outside starts to warm up.
1) Check to make sure all your fans are operational. Regardless of the type of drying system you use, it is possible that a fan is not operating and as a result, some molds are seeing less air movement.
2) Look for hot spots in the room. The outside walls may start to radiate more heat and molds in that area may start to heat up.
3) Ensure that your RH sensors have been calibrated.
4) Evaluate your current intra-coat dry time against your standard. Changes in your throughput over time can impact dry time between coats.
5) Review your final dry procedures. Are the molds being exposed to enough air flow during final dry?
Obviously, there are a number of factors that can cause shell cracking. But, taking a little time to evaluate changes in your drying conditions will help in identifying the root cause of the cracking. If this review doesn’t resolve your issue, at least you can feel confident to move onto other potential causes of the cracking .
If you want to talk about where your process variability might be coming from, send me a quick email at Julie@keyprocessinnovations.com and I would be happy to help you troubleshoot your process.

by Julie | May 29, 2012 | Consulting
I am frequently asked how often should I test my slurry? I know you shouldn’t answer a question with a question, but what about a series of questions?
✓ How often do you have to make adjustments to your slurry?
✓ Are the adjustments with water, binder or a mixture of both?
✓ Do the components of the adjustment change every time?
✓ Do you have to add so many liquids that flour needs to be added to thicken up the slurry?
✓ Are these adjustments as a result of periodic viscosity checks or from the slurry testing?
The goal of your testing frequency should be as little as possible while ensuring the key parameters are in range. I have seen some customers test their slurries on a daily basis and some do no testing at all.
I firmly believe that if you control your inputs, slurry control will be much easier and a result, less testing is required. That means that you must monitor the material being fed into the slurry tanks and make adjustments prior to adding them into the dip tanks. If the make-up tanks are in range, it would stand to reason that the slurry dip tanks will also be in range. But, what if the make-up tanks aren’t maintained in range?
If you have questions about how to ensure the make-up tanks are in control, read Shark Teeth or an Iowa Cornfield?
If you start to understand why the adjustments are being made and take steps to correct those parts of the process which are causing the variability, then you will be on your way to having a more robust process which will allow the operators to spend less time testing the slurries and more time on production.
If you want to talk about where your process variability might be coming from, send me a quick email at Julie@keyprocessinnovations.com and we can discuss your situation in greater detail.